Anthropogenic global warming is a feature of Earth’s current climate system: It is a fact.
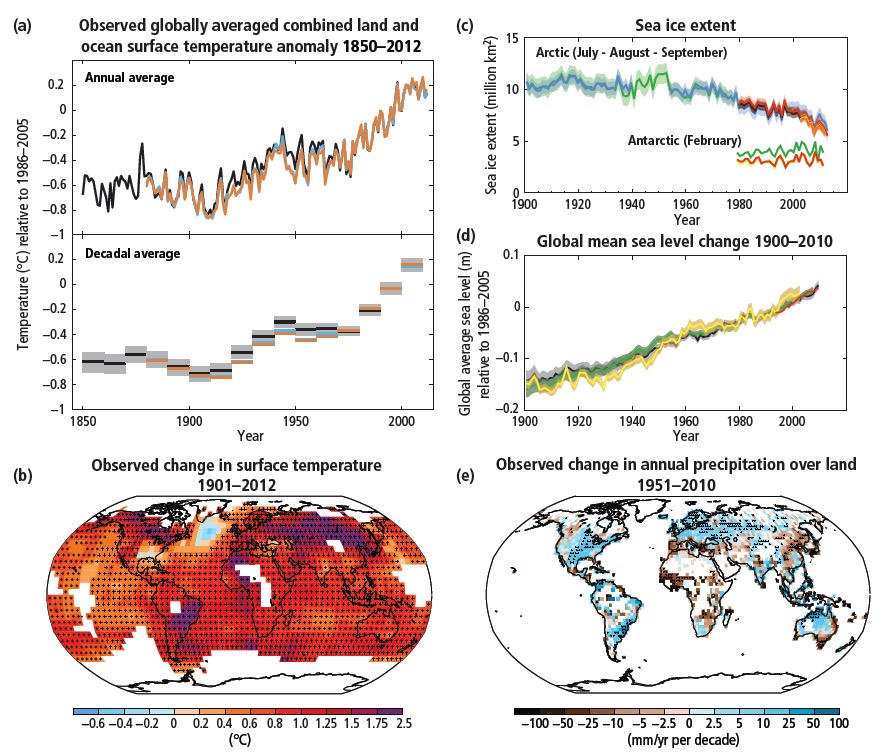
Reliably recognizing explicitly anthropogenic contributions to the global warming that is apparent in climate data over the last 2 centuries is not a trivial exercise and the reality of this contribution is the product of intense work by thousands of scientists since the 1970s (the plots below are from the 2014 IPCC report that summarizes recent efforts). Concerns about anthropogenic global warming have, however, a very long history: In1896 Svante Arrhenius wrote a paper on the potential climate warming effects of the excess coal burning that characterized the early industrial revolution. Why is it hard to see our effects on climate? In addition to collecting data with sufficient spatial and temporal coverage to permit even asking the question about the role of humans in the current climate crisis, a first problem is to characterize the baseline climate variability that defines the surface Earth system. How can we observe a departure from “normal” if we do not know what is normal?
In this module you will learn a few tools that will enable you to interrogate any class of time series data. Our subject will be recent climate change because it is topical and the data is easy to find on the web. However, the tools you will develop can be applied anywhere-- from the first story you read about the role of large igneous province basalt volcanism in the demise of dinosaurs, to recognizing biotic responses to snowball Earth in carbon isotope data to the stories we will explore related to oxygen rise and the Earth “breathing” by plate tectonics.
In a first exercise to whet your observational skills, you will read a paper by Watson and coauthors on the challenge of recognizing the causes for a recent acceleration in sea level rise. Indeed, for the first ~150 years of anthropogenic global warming (1850-2000) the predominant signal in the sea level record was simply that related to the thermal expansion if water (warm any confined liquid and it expands). As you will see, one of the most daunting challenges in unraveling the consequences of global warming for sea level rise and projecting its effects into the future is resolving the contributions of glacial melt-water from Greenland and Antarctica.
Watson et al, 2015, Unabated sea level-rise in the satellite altimeter era
During class you will do a hands-on project in which you will learn some basic data analysis tools while working with time series of surface temperature.
Computer lab instructions (TBA)